Testing the connection to the current game server
You can test connection either automatically by script (more preferable) or by hand (less preferable)
Option A: Using the script (Windows 7 and above)
Open your game installation folder and go to the con_tester subdirectory
In this directory you will find two scripts:
After executing the main script, it will expect an entry in the game.log with the server IP address.
This entry only appears if your ship ever departures on the map today
If you did not play a battle yet, there will be no such string. And the script will wait until a battle is started.
If you played at least one battle, the last server address will be used.
If there are multiple enties, the last one will be used:
Quote
Waiting for DS server record in game.log
play any map to continue or press CtrlC to exit…
1. Run tests Instantly via the current (latest) server
‘Instantly’ - means tests will be performed immediately after running a script, unlike the other script in paragraph 2. (below)
Run SC_Active_Srv_nettest.cmd
If you run the script while being in battle, the current server will be checked.
If you run the script being in the hangar, the last server you played on will be used.
Window will be opened with testing procedure of the current (latest) server :
Quote
*********************************************************
0:29:18 2014-12-10 (Wed Dec 2014) RTZ 2 (чшьр) UTC+03:00
LoadBalancer [RU] 91.230.61.25
Shard [RU] 5.153.37.199
Chat [RU] 91.230.61.97
Dedicated [US] 219.18.15.139
Tracing route to 219.18.15.139
over a maximum of 30 hops:
0 1.2.3.4
1 10.20.6.1
2 178.18.224.34
3 80.64.96.1
4 81.27.252.118
5 219.18.15.139
Computing statistics for 125 seconds…
Source to Here This Node/Link
Hop RTT Lost/Sent = Pct Lost/Sent = Pct Address
0 1.2.3.4
0/ 100 = 0% |
1 1ms 0/ 100 = 0% 0/ 100 = 0% 10.20.6.1
0/ 100 = 0% |
2 1ms 0/ 100 = 0% 0/ 100 = 0% 178.18.224.34
0/ 100 = 0% |
3 18ms 1/ 100 = 1% 1/ 100 = 1% 80.64.96.1
0/ 100 = 0% |
4 8ms 0/ 100 = 0% 0/ 100 = 0% 81.27.252.118
9/ 100 = 9% |
5 9ms 9/ 100 = 9% 0/ 100 = 0% 219.18.15.139
Trace complete.
Post a screenshot of the results and attach the [game logs](< base_url >/index.php?/topic/25328-how-to-create-bug-reports/).
2. Run the script in monitor mode: automatically run tests on high packet loss detection.
PacketLoss_Trapper.cmd
Use this script when you want to keep track of the deteriorations of the connection.
When you run the script, it starts monitoring the game.log for records on the communication with the server.
Use this script when you want to keep track of the link quality to the server. It will immediately run tracert and ping on packet loss above 10% :
Quote
Waiting for DS server record in game.log
play any map to continue or press CtrlC to exit…DS record found
Monitoring game.log for packet loss record >10% at 1 seconds intervals
Once the deterioration is detected (packet loss > 10%), it starts tracert and modified ping utility to server. Each one in its own window.
Each line in pings window shows: average delay, packet loss, number of packets sent (the percentage of losses):
Quote
0:48:39 2014-12-10 (Wed Dec 2014) RTZ 2 (чшьр) UTC+03:00
Pinging current server.
Press Ctrl-C to exit or just close this window
[0:48:47] 91.230.61.167: avg:42ms lost:0/8 (0%)
[0:48:55] 91.230.61.167: avg:42ms lost:0/8 (0%)
[0:49:03] 91.230.61.167: avg:42ms lost:0/8 (0%)
In the second window you will see tracert in a loop.
Quote
0:48:38 2014-12-10 (Wed Dec 2014) RTZ 2 (чшьр) UTC+03:00
Tracing current server.
Log file is: nettest-tracing.15.12.2014.log
[0:48:38] Run 1. Collecting tracing data. Press Ctrl-C to abort…
Tracing route to 91.230.61.167 with the maximum number of hops 30
1 2 ms 1 ms 1 ms 192.168.1.1
2 11 ms 5 ms 7 ms 187.24.238.1
3 * 2 ms 2 ms 95.54.92.82
4 30 ms 30 ms 29 ms 95.167.92.31
5 43 ms 42 ms 58 ms 81.91.186.66
6 42 ms 42 ms 44 ms 91.230.61.167
Trace completed.
[0:48:53] Run 2. Collecting tracing data. Press Ctrl-C to abort…
Tracing route to 91.230.61.167 with the maximum number of hops 30
Both utilities will run in a loop.
Let them run for at least a minute to collect enough statistics.
To stop utilities, in each window press Ctrl + C and confirm the completion.
If the problem has been identified and is visible, take a screenshot and proceed as stated above
The utility detects the switching of the game servers and will determine the correct one for the next test. Therefore, you can play and keep the script running in background. Don’t worry, you won’t miss any important information. The script keeps a log file of all traces (see below).
Every tracert run is logged into the file named nettest-tracing.<current date>.log
The results of the ping utility will not be saved in the log file.
This way you can play a lot of battles in a row and view the content of the log file.
If a problem is detected, attach the screenshots and the log file. If you do not see a problem in the screenshots (but there is a log file) - only attach the log. Screenshots are only needed for convenience when watching posts on the Forum.
Option B: Running tests manually (less preferable)
please note in text there are also for MAC OSx actions
This option should only be used when it is not possible to use the automated windows script (Option B).
1. Find the IP address of the current server from the active game.log file located here:
Quote
-
For Win XP: {drive}: \Documents and Settings {username} \My Documents\My My Games\StarConflict\logs\
-
For Win Vista/7: {drive}:/Users/{username} \Documents\My Games\StarConflict\logs\
Linux: ~/.local/share/starconflict/logs/
MAC OS: Users\<user>\Library\Application Support\Star Conflict\logs\
Navigate to the log folder (direcotry shown above), sort the content by date and open the newest folder.
For example: …My Games\StarConflict\logs\2015.10.09 22.18.55
There may be several directories with the same date, therefore it is required to look for the the time as well.
Open the file: game.log
Search the game.log for the string: client: connected to
There may be several strings. You need the last one.
If you did not play a battle (some map) yet, there will be no such string for today’s game.log
An example of the string:
12:21:54.115 | client: connected to 219.18.15.139|35004, setting up session…
Server IP address: 219.18.15.139
If you searched while being in battle, then the IP will be shown from the current server.
If you searched immediately after the end of the battle, then the IP will be shown from the last server you played on.
Servers can vary from battle to battle.
2. Checking latencies and packet losses:
2.1. WINDOWS
Click run, type cmd.exe and hit Enter . The black window will appear
2.1.1. Type the following command into cmd:
PathPing -n -4 -w 500 < Server IP address >
,where < Server IP address > - the IP address found in the log
NOTE: -l 64 .This is an ‘el’ letter (small ‘L’). The letters are case sensitive!
For example: PathPing -n -4 -w 500 219.18.15.139
2.1.2. As a result you will get something similar to this:
Quote
Tracing route to 219.18.15.139
over a maximum of 30 hops:
0 1.2.3.4
1 10.20.6.1
2 178.18.224.34
3 80.64.96.1
4 81.27.252.118
5 219.18.15.139
Computing statistics for 125 seconds…
Source to Here This Node/Link
Hop RTT Lost/Sent = Pct Lost/Sent = Pct Address
0 1.2.3.4
0/ 100 = 0% |
1 1ms 0/ 100 = 0% 0/ 100 = 0% 10.20.6.1
0/ 100 = 0% |
2 1ms 0/ 100 = 0% 0/ 100 = 0% 178.18.224.34
0/ 100 = 0% |
3 18ms 1/ 100 = 1% 1/ 100 = 1% 80.64.96.1
0/ 100 = 0% |
4 8ms 0/ 100 = 0% 0/ 100 = 0% 81.27.252.118
9/ 100 = 9% |
5 9ms 9/ 100 = 9% 0/ 100 = 0% 219.18.15.139
Trace complete.
2.2. [MAC OSX]
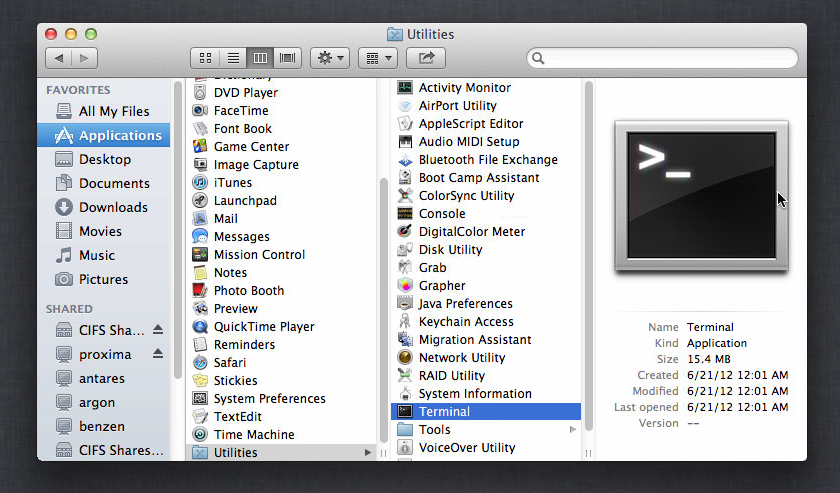
2.2.1. Open Terminal (Applications => Utilities => Terminal)
2.2.1. Type the following command into Terminal window:
traceroute -I < Server IP address >
,where < Server IP address > - the IP address found in the game.log
-I .This is a big ‘i’ letter The letters are case sensitive!
For example: traceroute -I 219.18.15.139
you will see something like this:
traceroute -I 219.18.15.139
traceroute to node76ar-sx.star-conflict.com (219.18.15.139), 64 hops max, 72 byte packets
 1  192.168.20.1 (192.168.20.1)  0.357 ms  0.205 ms  0.240 ms
 2  192.168.20.5 (192.168.20.5)  1.063 ms  0.811 ms  0.776 ms
 3  vl1434.ar14-24.ndl.um.compunet.net (62.24.5.16)  1.615 ms  1.312 ms  0.920 ms
 4  bundle-ether2-4002.sr35-02.ndl.um.compunet.net (21.82.3.87)  1.659 ms  4.280 ms
 5  miran.spb.cloud-ix.net (31.28.18.22)  45.098 ms  45.261 ms  60.774 ms
 6  host62-80.miran.ru (91.142.80.62)  45.187 ms  45.954 ms  45.230 ms
 7  node50ar-sx.star-conflict.com (219.18.15.139)  43.084 ms  43.006 ms  43.037 ms
2.3. Take a screenshot
Sc_NetTest-0.4.2.2.zip


